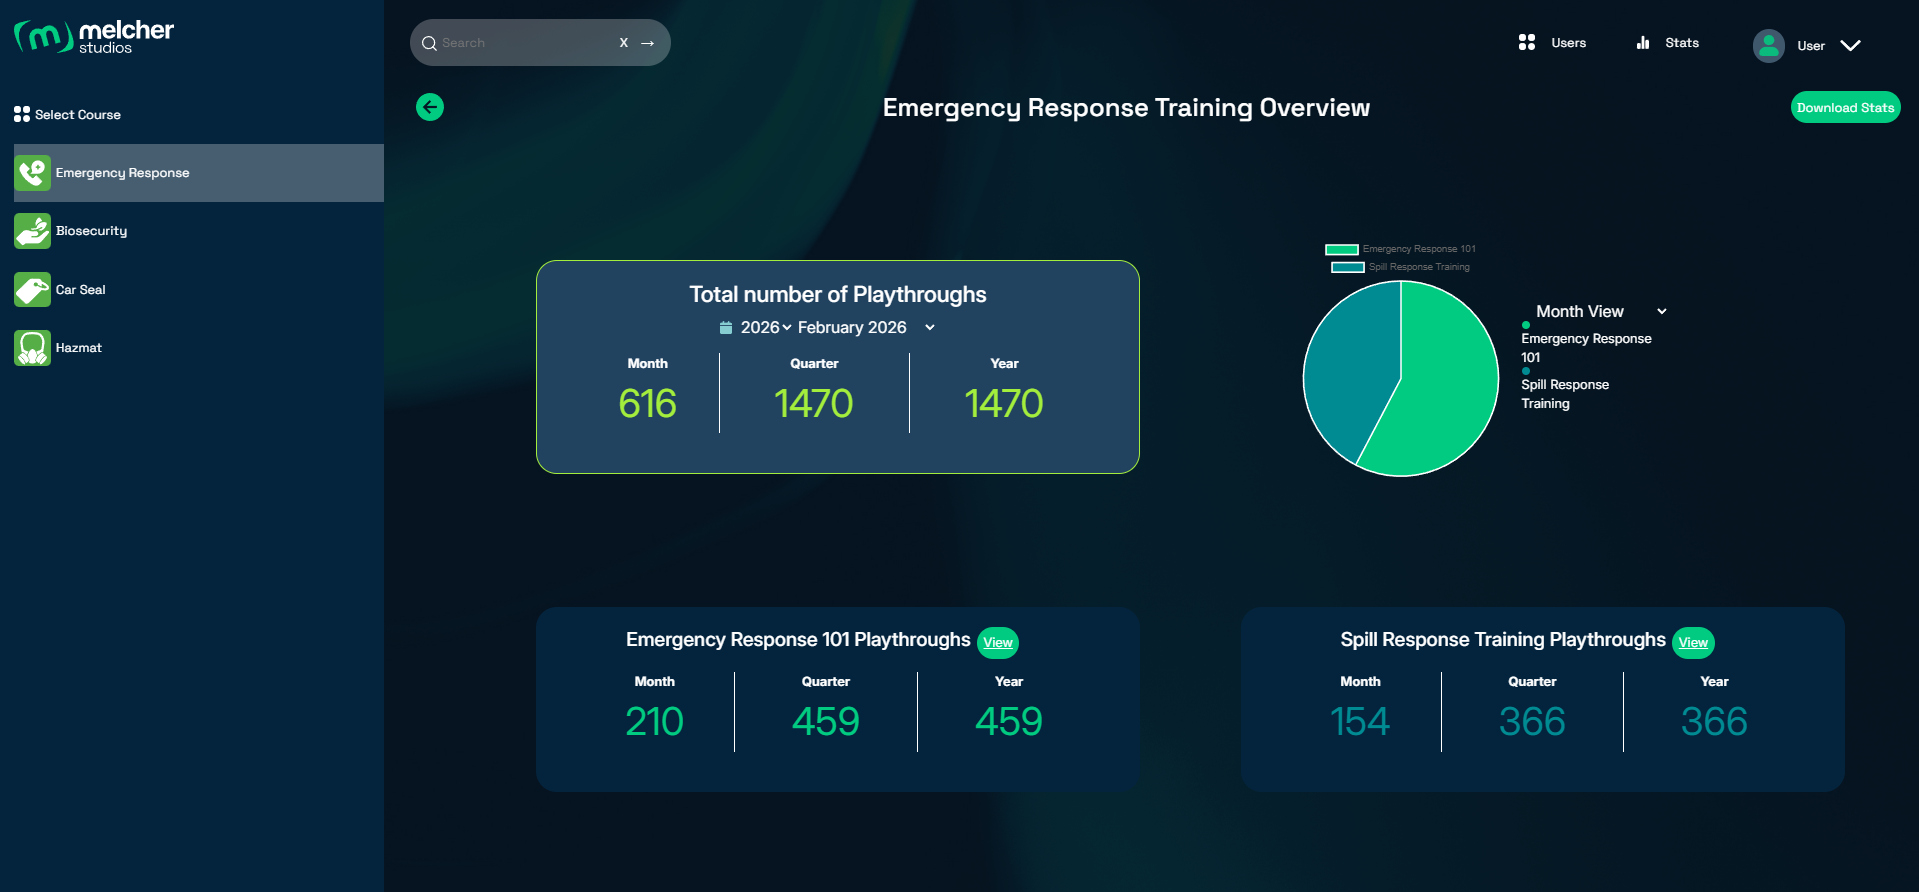
Platforms

Stats Hub

Actionable analytics from every VR and MR training session — so you can measure what matters and optimize outcomes.

One of the most beneficial outcomes of VR and MR training is the ability to collect an endless supply of statistics and analytics. We work with the client to determine their goals in terms of data collection. This can allow them to pinpoint exactly where people struggle within their training. Where are the bottlenecks? What is causing the outcomes they are seeing? With this data they can then adjust course to ensure the training is working as efficiently as possible, and is delivering the expected results.

Analytics Features

What We Track

Funnels icon

Funnels

  • Record the critical actions a user makes from the start to the end of a process
  • Catch common difficulties and rare accomplishments made by the player
  • Observe the most and least performant app-paths that drive a user to sign-up, make a purchase, etc.
Heatmaps icon

Heatmaps

  • Visualize spatial data intuitively
  • Indicate where players spend the most and least amount of time
  • With VR, this can also be extended to monitor the player's gaze
Performance statistics icon

Common Performance Statistics

  • Number of downloads, active user count, total user count
  • Average length of play
  • Time spent in a given scenario
  • Type of device and operating system
Trends icon

Trends

  • Compare data between users and look for trends
  • Is one option chosen more regularly than another?
  • Is another option underutilized?
User-base analysis icon

User-base Analysis

  • Geographical display of users
  • Visualize where a product is being used across the globe
Stats Hub dashboard overview

Dashboard Overview

  • Centralized view of all key metrics at a glance
  • Real-time data feeds from active VR and MR sessions

Get in touch for pricing and custom analytics configurations.

Get in Touch
Translating…